Gross rental profitability in 38 cities of Colombia: where you pay the most to buy for rent (October 2026)
Machine-assisted English version of the Spanish original by Aptología. All figures are locked to the original (numbers are copied, not re-translated); if in doubt, the Spanish original prevails.
Buying an apartment to rent it yields more in Barranquilla, with an implicit gross return of 8.9% annually, and less in Zipaquirá, with 6.0%. In Bogotá the gross profitability is 8.0%; the median of 38 cities, 6.9%.
Abstract: We cross-rent and sell by m² of 184,855 apartments in 38 Colombian cities.
Updated: 18 October 2026 (data from 18 October 2026) · Next update: monthly.
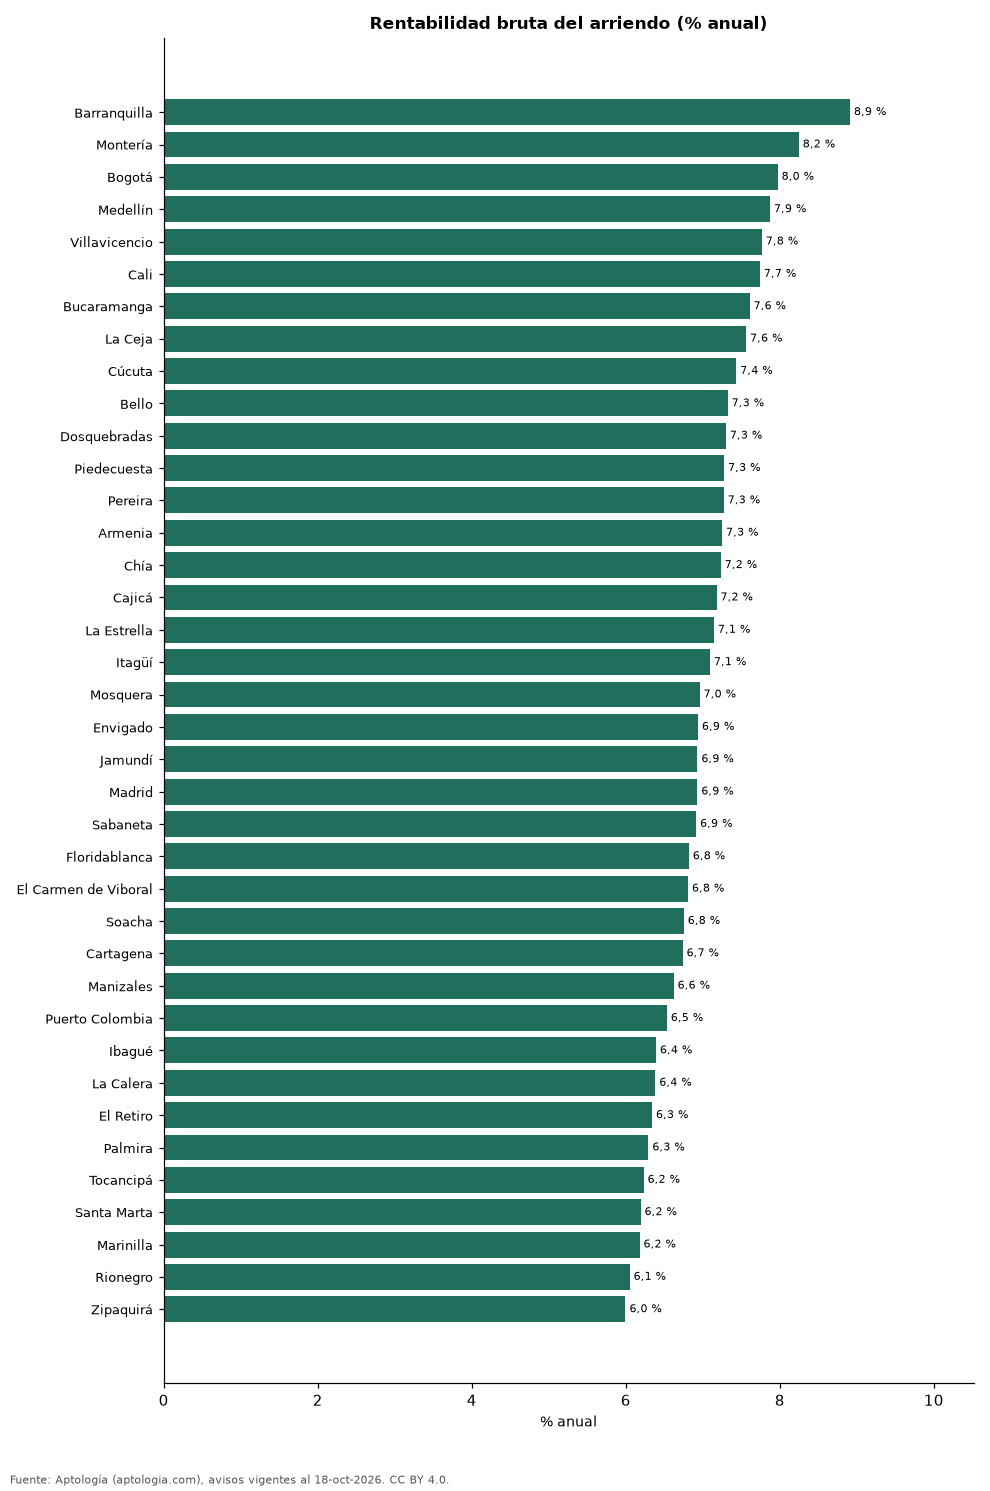
Summary
| Indicator | Value |
|---|---|
| Major | Barranquilla: 8.9% |
| Minor | Zipacyrá: 6.0% |
| Bogotá | 8.0% |
| Median | 6.9% |
Profitability by city
| City | Gross return | Rental per m² per month | Sale by m² | Announcements (rental / sale) |
|---|---|---|---|---|
| Barranquilla | 8.9% | 33,654 pesos | 4,531,707 pesos | 3,694 / 7,532 |
| Mounting | 8.2% | 25,556 pesos | 3,718,519 pesos | 44 / 288 |
| Bogotá | 8.0% | 48,246 pesos | 7,261,905 pesos | 12,954 / 31,265 |
| Medellin | 7.9% | 49,206 pesos | 7,500,000 pesos | 20,068 / 20,515 |
| Villavicencio | 7.8% | 27,212 pesos | 4,203,958 pesos | 74 / 347 |
| Cali | 7.7% | 30,000 pesos | 4,650,000 pesos | 1,499 / 9,365 |
| Bucaramanga | 7.6% | 29,588 pesos | 4,666,667 pesos | 416 / 2,439 |
| The eyebrow | 7.6% | 37,323 pesos | 5,922,147 pesos | 354 / 312 |
| Cucutta | 7.4% | 22,007 pesos | 3,551,857 pesos | 298 / 561 |
| Beautiful | 7.3% | 33,333 pesos | 5,461,538 pesos | 1,082 / 2,319 |
| Two-broken | 7.3% | 28,193 pesos | 4,634,146 pesos | 70 / 607 |
| Piedecha | 7.3% | 22,222 pesos | 3,664,236 pesos | 57 / 246 |
| Pereira | 7.3% | 33,333 pesos | 5,500,000 pesos | 1,530 / 4,376 |
| Armenia | 7.3% | 32,222 pesos | 5,332,556 pesos | 337 / 2,278 |
| Chia | 7.2% | 33,333 pesos | 5,529,412 pesos | 489 / 1,507 |
| Cajicá | 7.2% | 33,929 pesos | 5,671,642 pesos | 385 / 1,517 |
| The Star | 7.1% | 38,333 pesos | 6,438,356 pesos | 489 / 561 |
| Itagüí | 7.1% | 40,000 pesos | 6,766,968 pesos | 908 / 2,012 |
| Mosquera | 7.0% | 28,571 pesos | 4,926,471 pesos | 167 / 817 |
| Envigado | 6.9% | 48,864 pesos | 8,452,381 pesos | 7,303 / 5,735 |
| Jamundí | 6.9% | 20,690 pesos | 3,582,207 pesos | 107 / 466 |
| Madrid | 6.9% | 20,833 pesos | 3,607,843 pesos | 259 / 475 |
| Sabaneta | 6.9% | 41,026 pesos | 7,121,212 pesos | 3,868 / 4,375 |
| Floridablanca | 6.8% | 29,412 pesos | 5,176,224 pesos | 357 / 919 |
| El Carmen de Viboral | 6.8% | 25,391 pesos | 4,475,422 pesos | 102 / 90 |
| Soacha | 6.8% | 19,098 pesos | 3,393,617 pesos | 128 / 566 |
| Cartagena | 6.7% | 44,118 pesos | 7,857,143 pesos | 2,008 / 5,774 |
| Manizales | 6.6% | 31,199 pesos | 5,653,956 pesos | 282 / 2,788 |
| Puerto Colombia | 6.5% | 31,944 pesos | 5,867,102 pesos | 90 / 144 |
| Ibagué | 6.4% | 22,581 pesos | 4,239,130 pesos | 249 / 1,217 |
| La Calera | 6.4% | 31,034 pesos | 5,833,333 pesos | 51 / 139 |
| The Retreat | 6.3% | 49,254 pesos | 9,321,839 pesos | 541 / 618 |
| Palmira | 6.3% | 22,000 pesos | 4,194,668 pesos | 42 / 112 |
| Tocancipa | 6.2% | 18,924 pesos | 3,644,068 pesos | 94 / 264 |
| Santa Marta | 6.2% | 45,000 pesos | 8,720,930 pesos | 674 / 3,779 |
| Marinilla | 6.2% | 29,091 pesos | 5,649,750 pesos | 107 / 164 |
| Rionegro | 6.1% | 37,500 pesos | 7,437,500 pesos | 3,179 / 3,023 |
| Zipakirah | 6.0% | 21,818 pesos | 4,366,197 pesos | 168 / 819 |
Gross return = medium rental per m² × 12 -medium price of sale per m² (apartments).
Frequently asked questions
Where is it more cost-effective to buy to rent in Colombia? In Barranquilla, with 8.9% gross per year according to the October offer of 2026.
How much does an apartment rent in Bogotá? 8.0% gross annual, before HOA fee, predial, vacations and maintenance.
Methodology
- Source: night events of the Aptology database (aptologia.com) of 18 October 2026: current housing ads in real estate portals of 13 countries, collected by Aptology and seen online between 11 and 18 October 2026. Court: 18 October of 2026.
- Debugging: exact duplicates (same city, area, type, price, currency, area, rooms and bathrooms) and prices outside the percentile 1 - 99 of each country, operation, currency and type are removed; the price per m² uses only ads with declared area between 12 and 2,000 m² and is also cut to P1-P99.
- What is measured: prices ordered (published), not closing prices. For rent, monthly rent without HOA fee, common expenses or condo.
- Minimum sample: each published figure is based on at least 30 ads; cells with less are omitted.
- Colombia: Prices in Colombian pesos, no currency conversion. The indicators of furnished, pets, closed set, balcony and direct ad of the owner only exist for rent and come from the portals.
- Gross return: approach with medium of two different offers (rental and sale) of the same city.
- Limitations: The coverage depends on the portals that travel Aptology in each country and is greater in large cities and in the medium-high and high segments; the area is the one that declares the announcement, unverified; the area names come from the portals.
- Privacy: only aggregates are published; no personal data, link to ads or name of advertiser is published.
- Open data: datos.csv, CC BY license 4. 0.
How to quote
Pinzón Pineda, D. M. (2026). Gross rental profitability in 38 cities of Colombia: where you pay the most to buy for rent (October 2026). Aptology (aptologia.com). https://github.com/elbroker/aptologia-datos/tree/main/estudios/rentabilidad-alquiler-ciudades-colombia-2026. Data: datos.csv, CC BY license 4. 0.
Sources and data
- DOI: 10.5281/zenodo.23460750 (Zenodo)
- Original study (Spanish): Rentabilidad bruta del arriendo en 38 ciudades de Colombia: dónde rinde más comprar para arrendar (octubre 2026)
- GitHub (CSV, PDF): https://github.com/elbroker/aptologia-datos/tree/main/estudios/rentabilidad-arriendo-ciudades-colombia-2026
- Hugging Face: https://huggingface.co/datasets/aptologia/rentabilidad-arriendo-ciudades-colombia-2026