How much the price of square meter varies within each city of Colombia: dispersion in 37 cities (October 2026)
Machine-assisted English version of the Spanish original by Aptología. All figures are locked to the original (numbers are copied, not re-translated); if in doubt, the Spanish original prevails.
In Santa Marta the square meter of the typical expensive apartment (percentile 75) costs 1.93 times that of the typical cheap (percentile 25), the largest dispersion of 37 Colombian cities; in Tocancipá the relationship is only 1.18. In Bogotá the range ranges from 5.81 million pesos to 9.19 million pesos per m² (1.58 times). A high dispersion indicates that the neighborhood and estrato weigh more on the price.
Abstract: We compare the price percentiles per m² of 120,352 apartments for sale in 37 cities with 100 ads or more.
Updated: 18 October 2026 (data from 18 October 2026) · Next update: monthly.
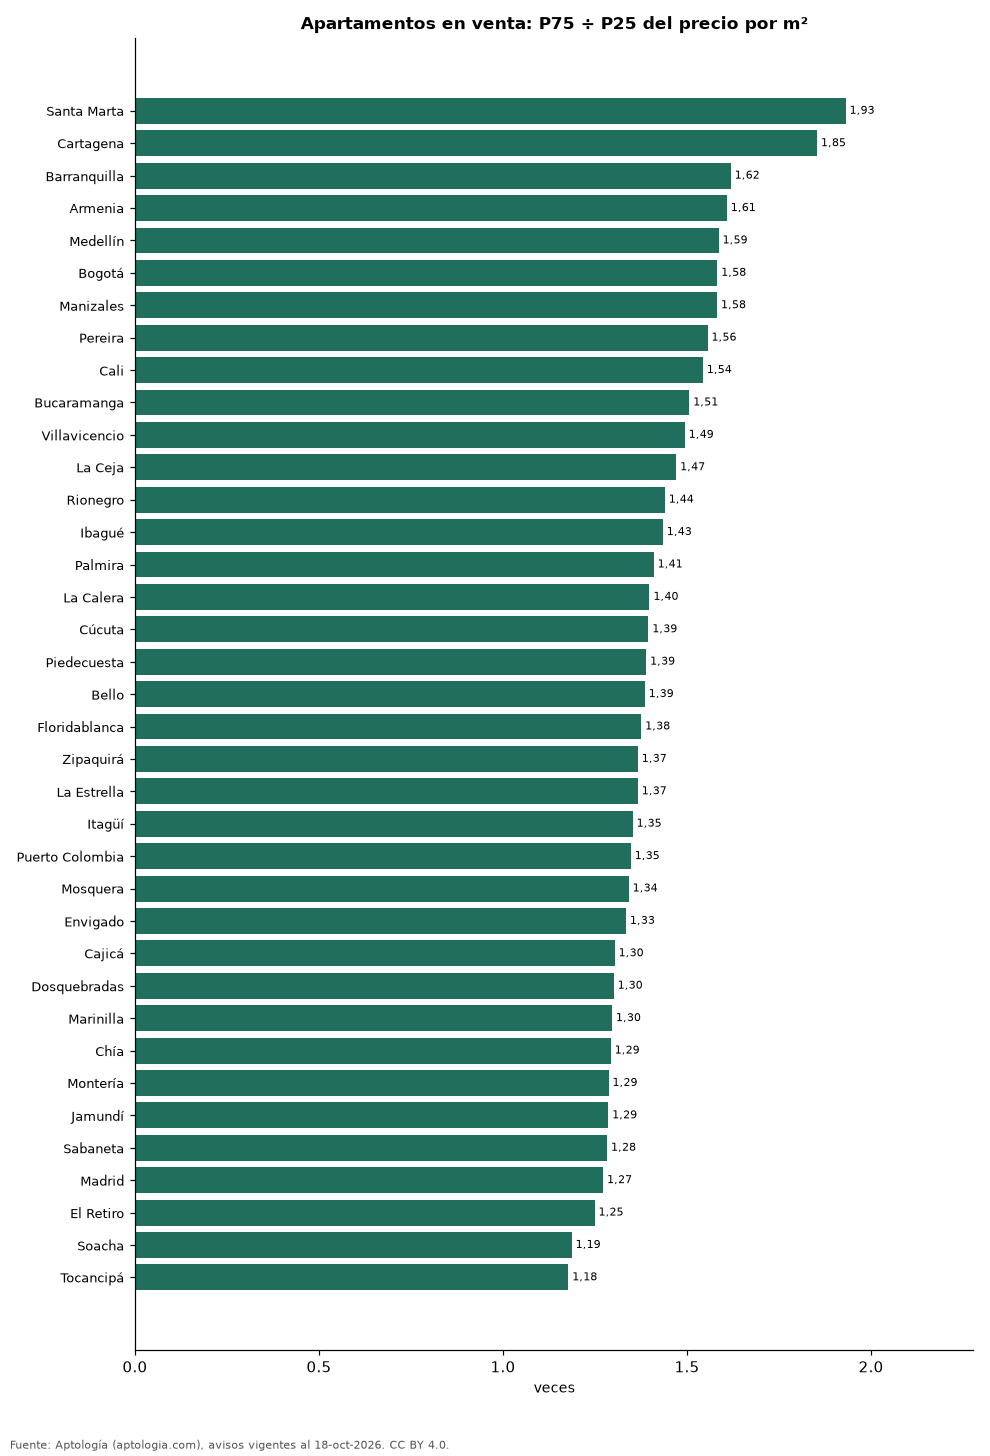
Summary
| Indicator | Value |
|---|---|
| Increased dispersion | Santa Marta: 1.93 × |
| Less dispersion | Tocantipa: 1.18 × |
| Bogotá | 1.58× |
Percent price per m² per city
| City | P25 (million / m²) | Median | P75 | P75 ÷ P25 | Announcements |
|---|---|---|---|---|---|
| Santa Marta | 5.64 | 8.72 | 10.89 | 1.93 | 3,779 |
| Cartagena | 5.69 | 7.86 | 10.54 | 1.85 | 5,774 |
| Barranquilla | 3.58 | 4.53 | 5.79 | 1.62 | 7,532 |
| Armenia | 4.09 | 5.33 | 6.58 | 1.61 | 2,278 |
| Medellin | 5.87 | 7.50 | 9.32 | 1.59 | 20,515 |
| Bogotá | 5.81 | 7.26 | 9.19 | 1.58 | 31,265 |
| Manizales | 4.43 | 5.65 | 7.01 | 1.58 | 2,788 |
| Pereira | 4.33 | 5.50 | 6.73 | 1.56 | 4,376 |
| Cali | 3.89 | 4.65 | 6.00 | 1.54 | 9,365 |
| Bucaramanga | 3.84 | 4.67 | 5.79 | 1.51 | 2,439 |
| Villavicencio | 3.57 | 4.20 | 5.33 | 1.49 | 347 |
| The eyebrow | 5.10 | 5.92 | 7.50 | 1.47 | 312 |
| Rionegro | 6.02 | 7.44 | 8.67 | 1.44 | 3,023 |
| Ibagué | 3.49 | 4.24 | 5.00 | 1.43 | 1,217 |
| Palmira | 3.55 | 4.19 | 5.00 | 1.41 | 112 |
| La Calera | 4.82 | 5.83 | 6.73 | 1.40 | 139 |
| Cucutta | 3.04 | 3.55 | 4.24 | 1.39 | 561 |
| Piedecha | 3.16 | 3.66 | 4.39 | 1.39 | 246 |
| Beautiful | 4.62 | 5.46 | 6.39 | 1.39 | 2,319 |
| Floridablanca | 4.35 | 5.18 | 5.98 | 1.38 | 919 |
| Zipakirah | 3.61 | 4.37 | 4.93 | 1.37 | 819 |
| The Star | 5.49 | 6.44 | 7.50 | 1.37 | 561 |
| Itagüí | 5.70 | 6.77 | 7.71 | 1.35 | 2,012 |
| Puerto Colombia | 4.78 | 5.87 | 6.44 | 1.35 | 144 |
| Mosquera | 4.12 | 4.93 | 5.53 | 1.34 | 817 |
| Envigado | 7.20 | 8.45 | 9.61 | 1.33 | 5,735 |
| Cajicá | 5.00 | 5.67 | 6.52 | 1.30 | 1,517 |
| Two-broken | 4.11 | 4.63 | 5.34 | 1.30 | 607 |
| Marinilla | 4.98 | 5.65 | 6.45 | 1.30 | 164 |
| Chia | 4.89 | 5.53 | 6.33 | 1.29 | 1,507 |
| Mounting | 3.27 | 3.72 | 4.20 | 1.29 | 288 |
| Jamundí | 3.18 | 3.58 | 4.09 | 1.29 | 466 |
| Sabaneta | 6.20 | 7.12 | 7.95 | 1.28 | 4,375 |
| Madrid | 3.25 | 3.61 | 4.13 | 1.27 | 475 |
| The Retreat | 8.29 | 9.32 | 10.35 | 1.25 | 618 |
| Soacha | 3.10 | 3.39 | 3.68 | 1.19 | 566 |
| Tocancipa | 3.40 | 3.64 | 4.00 | 1.18 | 264 |
P25 and P75 = percentiles 25 and 75 of the price ordered per m²; among them is the central half of the offer. Only cities with 100 ads or more with area.
Frequently asked questions
In which city of Colombia does the price of housing vary most? In Santa Marta: the P75 of the m² is 1.93 times the P25.
What is the normal range of m² in Bogotá? The central half of the supply is between 5.81 million pesos and 9.19 million pesos per m².
Methodology
- Source: night events of the Aptology database (aptologia.com) of 18 October 2026: current housing ads in real estate portals of 13 countries, collected by Aptology and seen online between 11 and 18 October 2026. Court: 18 October of 2026.
- Debugging: exact duplicates (same city, area, type, price, currency, area, rooms and bathrooms) and prices outside the percentile 1 - 99 of each country, operation, currency and type are removed; the price per m² uses only ads with declared area between 12 and 2,000 m² and is also cut to P1-P99.
- What is measured: prices ordered (published), not closing prices. For rent, monthly rent without HOA fee, common expenses or condo.
- Minimum sample: each published figure is based on at least 30 ads; cells with less are omitted.
- Colombia: Prices in Colombian pesos, no currency conversion.
- Limitations: The coverage depends on the portals that travel Aptology in each country and is greater in large cities and in the medium-high and high segments; the area is the one that declares the announcement, unverified; the area names come from the portals.
- Privacy: only aggregates are published; no personal data, link to ads or name of advertiser is published.
- Open data: datos.csv, CC BY license 4. 0.
How to quote
Pinzón Pineda, D. M. (2026). How much the price of square meter varies within each city of Colombia: dispersion in 37 cities (October 2026). Aptology (aptologia.com). https://github.com/elbroker/aptologia-datos/tree/main/estudios/dispersion-del-precio-m²-ciudades-colombia-2026. Data: datos.csv, CC BY license 4. 0.
Sources and data
- DOI: 10.5281/zenodo.23471243 (Zenodo)
- Original study (Spanish): Cuánto varía el precio del metro cuadrado dentro de cada ciudad de Colombia: dispersión en 37 ciudades (octubre 2026)
- GitHub (CSV, PDF): https://github.com/elbroker/aptologia-datos/tree/main/estudios/dispersion-del-precio-m2-ciudades-colombia-2026
- Hugging Face: EXISTS aptologia/dispersion-del-precio-m2-ciudades-colombia-2026