Profitability of the rent in Bogotá by location and estrato: where you pay the most to rent (October 2026)
Machine-assisted English version of the Spanish original by Aptología. All figures are locked to the original (numbers are copied, not re-translated); if in doubt, the Spanish original prevails.
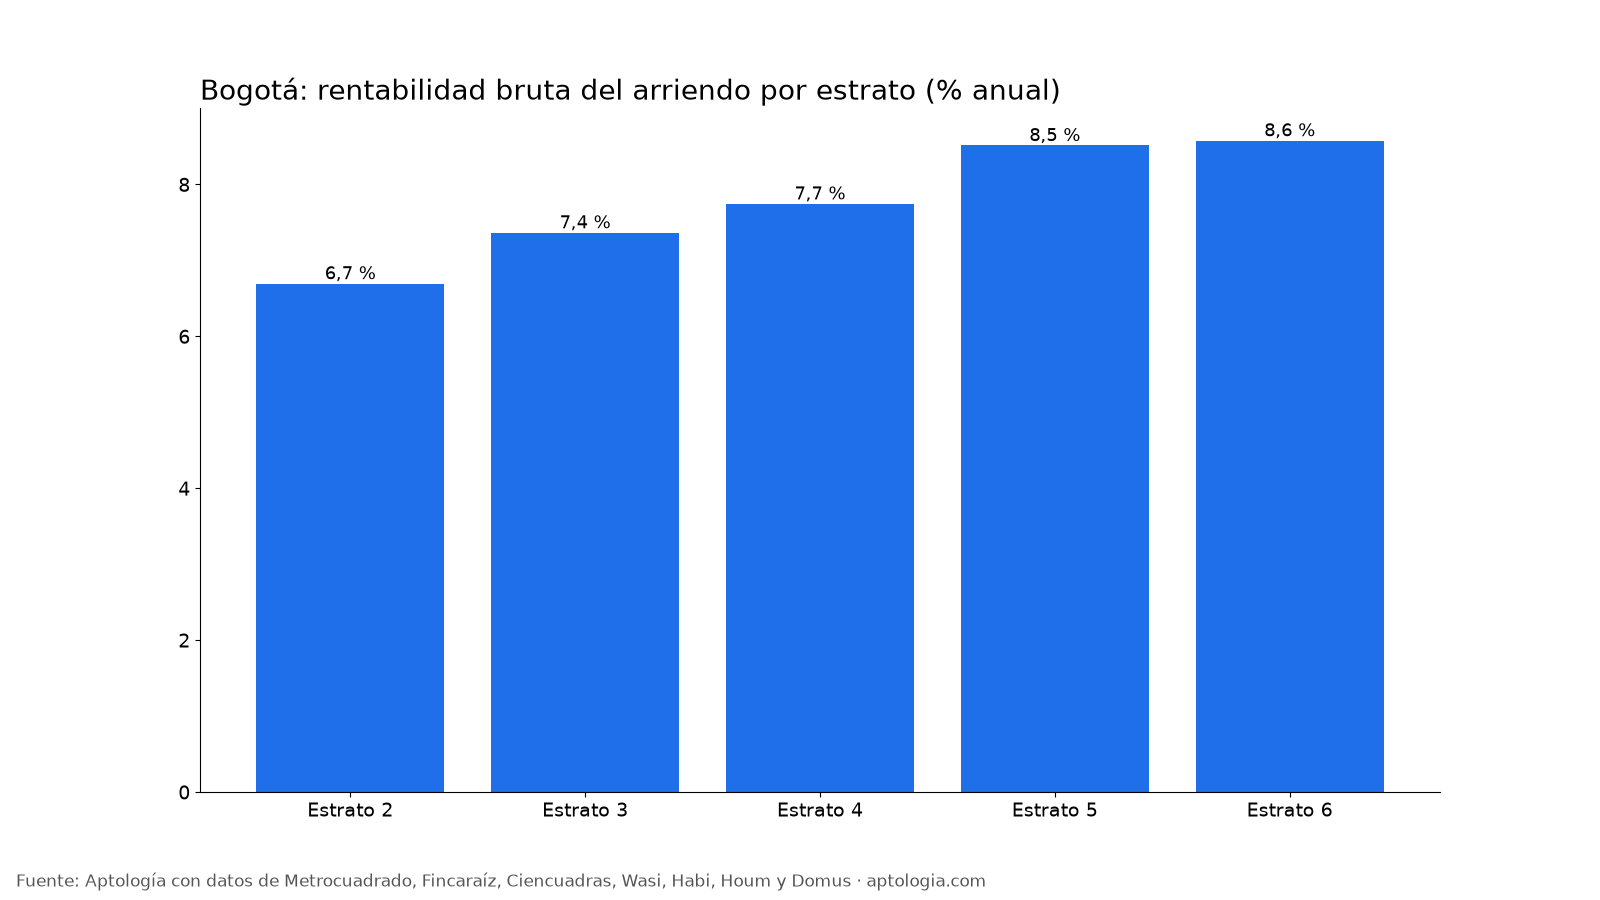
Buy an apartment to rent in Bogotá in gross 8.2% per year (the price is equivalent to 12.3 years of rent). By location, the gross profitability ranges from 5.7% in Antonio Nariño to 8.4% in Chapinero; by estrato, from 6.7% (estrato 2) to 8.6% (estrato 6).
Abstract: We cross the rental and sale price per m² of 14,931 apartments for rent and 36,813 for sale, unique, in Bogotá.
Updated: 18 October 2026 (data from 18 October 2026) · Next update: monthly.
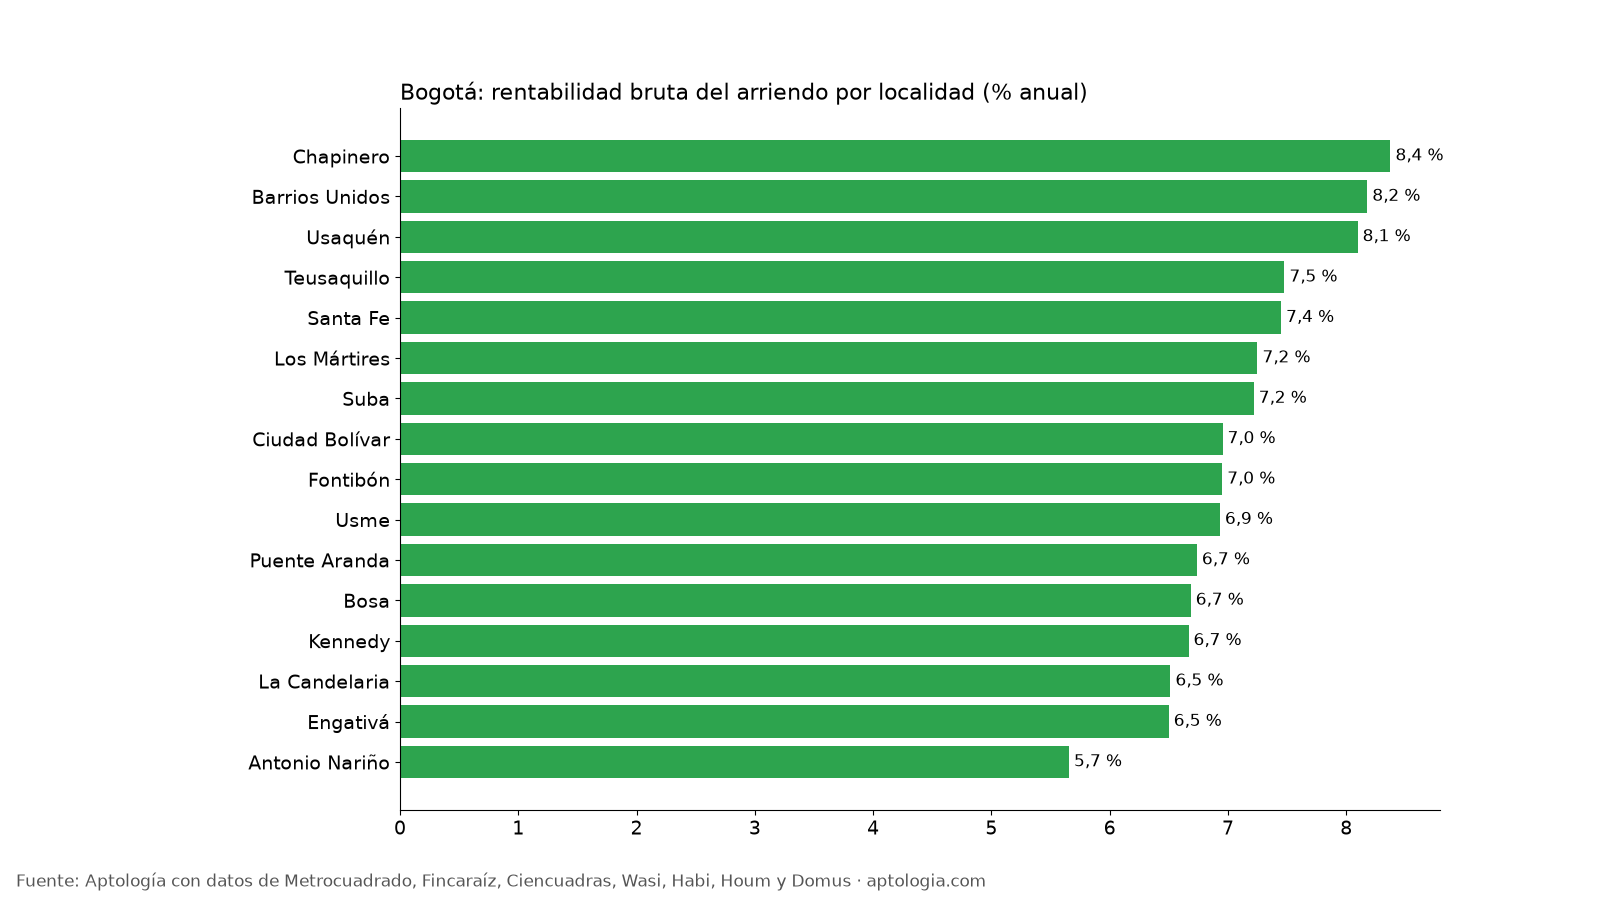
By locality
| Location | Gross return | Years of rent | Rental per m² | Sale by m² | Medium rental | Medium sale | Announcements (rental / sale) |
|---|---|---|---|---|---|---|---|
| Chapinero | 8.4% | 11.9 | $66,176 | $9,482,759 | $9,000,000 | $1.68 billion | 4,014 / 7,412 |
| Barrios United | 8.2% | 12.2 | $56,000 | $8,216,732 | $2,767,000 | $680 million | 644 / 1,061 |
| Usaquén | 8.1% | 12.4 | $50,000 | $7,410,714 | $4,100,000 | $880 million | 4,062 / 12,111 |
| Teusaquillo | 7.5% | 13.4 | $49,194 | $7,894,737 | $2,573,352 | $650 million | 644 / 1,401 |
| Santa Fe | 7.4% | 13.4 | $56,164 | $9,047,619 | $2,350,000 | $500 million | 557 / 766 |
| The Martyrs | 7.2% | 13.8 | $41,953 | $6,944,444 | $1,700,000 | $290 million | 191 / 390 |
| Up | 7.2% | 13.9 | $40,217 | $6,686,047 | $2,360,000 | $650 million | 1,697 / 5,966 |
| Ciudad Bolívar | 7.0% | 14.4 | $28,269 | $4,878,049 | $1,300,000 | $230 million | 112 / 396 |
| Fontibon | 7.0% | 14.4 | $40,000 | $6,904,762 | $1,800,000 | $425 million | 812 / 1,639 |
| Use me | 6.9% | 14.4 | $21,118 | $3,655,495 | $1,000,000 | $170 million | 103 / 248 |
| Aranda Bridge | 6.7% | 14.8 | $39,504 | $7,036,033 | $1,800,000 | $334 million | 327 / 501 |
| Bosa | 6.7% | 15.0 | $22,406 | $4,021,739 | $1,000,000 | $185 million | 149 / 643 |
| Kennedy | 6.7% | 15.0 | $31,746 | $5,714,286 | $1,500,000 | $275 million | 513 / 1,431 |
| La Candelaria | 6.5% | 15.4 | $48,628 | $8,958,333 | $2,000,000 | $509 million | 86 / 103 |
| Engativa | 6.5% | 15.4 | $30,053 | $5,548,780 | $1,650,000 | $330 million | 392 / 1,084 |
| Antonio Nariño | 5.7% | 17.7 | $28,452 | $6,036,725 | $1,480,000 | $330 million | 85 / 172 |
By estrato
| Strand | Gross return | Years of rent | Rental per m² | Sale by m² | Medium rental | Medium sale | Announcements (rental / sale) |
|---|---|---|---|---|---|---|---|
| 2 | 6.7% | 14.9 | $23,478 | $4,208,333 | $1,149,950 | $200 million | 520 / 1,587 |
| 3 | 7.4% | 13.6 | $34,524 | $5,625,000 | $1,585,981 | $285 million | 3,214 / 6,561 |
| 4 | 7.7% | 12.9 | $46,875 | $7,262,829 | $2,550,000 | $550 million | 3,476 / 7,637 |
| 5 | 8.5% | 11.7 | $54,054 | $7,619,048 | $4,200,000 | $857 million | 1,977 / 6,091 |
| 6 | 8.6% | 11.7 | $62,500 | $8,744,356 | $9,000,000 | $1.53 billion | 5,609 / 14,219 |
How to use it to decide: Gross profitability is a first filter. Refresh HOA fee, predial, emptiness, commission and maintenance, which are usually eaten from 1 to 2 points. For the detail neighborhood by neighborhood, look at the profitability study by neighborhood of Aptology.
Frequently asked questions
How much does an apartment rent in Bogotá? In gross, 8.2% per year: 12 months of rent per m² on the sale price per m², before expenditure (data of 18 October of 2026).
What is the most cost-effective place to buy for rent in Bogotá? Chapinero, with 8.4% gross per year among the localities with 80 ads or more for rent and sale.
What is the most profitable for rent in Bogotá? The estrato 6, with 8.6 gross annual.
Methodology
- Source: live housing ads collected by the intake of Aptology in Metrocuadrado, Fincaraíz, Cienaltes, Wasi, Habi, Houm and Domus, from 11 to 18 October of 2026. Court: 18 October of 2026.
- Debugging: the same property published several times is counted only once (grouping by portal and, between portals, by price, area, rooms and coordinates). Prices and areas out of range are excluded and, for rent, HOA fee is subtracted when the portal includes it in the rental.
- What is measured: prices ordered (published), not closing prices.
- Gross return: 12 × median rental per m² and median sales price per m² of the same group, in% per year. Years of rent = 100 ¬ profitability. Only groups with 80 ads or more for rent and sale.
- It is not the profitability of a building: the medium-sized ones come out of different ads and do not discount costs or taxes.
- Limitations: are prices ordered in portals, which may differ from the final value of rental or sale. The coverage is higher in the north of Bogotá and in estratos 4 to 6, because the published offer is concentrated there. The neighborhoods and the town come from what each portal writes; when the town is missing it is assigned by the nearest neighbouring ads.
- Open data: datos.csv, CC BY license 4. 0.
How to quote
Pinzón Pineda, D. M. (2026). Profitability of the rent in Bogotá by location and estrato: where you pay the most to rent (October 2026). Aptology. https://www.aptologia.com/estudios/rentabilidad-alquiler-bogota-por-localidad-y-estrato-2026. Data: datos.csv, CC BY license 4. 0.
Sources and data
- DOI: 10.5281/zenodo.23453707 (Zenodo)
- Original study (Spanish): Rentabilidad del arriendo en Bogotá por localidad y estrato: dónde rinde más comprar para arrendar (octubre 2026)
- GitHub (CSV, PDF): https://github.com/elbroker/aptologia-datos/tree/main/estudios/rentabilidad-arriendo-bogota-por-localidad-y-estrato-2026
- Hugging Face: https://huggingface.co/datasets/aptologia/rentabilidad-arriendo-bogota-por-localidad-y-estrato-2026