Profitability of the rent in Medellín by neighborhood: where you pay the most to rent (October 2026)
Machine-assisted English version of the Spanish original by Aptología. All figures are locked to the original (numbers are copied, not re-translated); if in doubt, the Spanish original prevails.
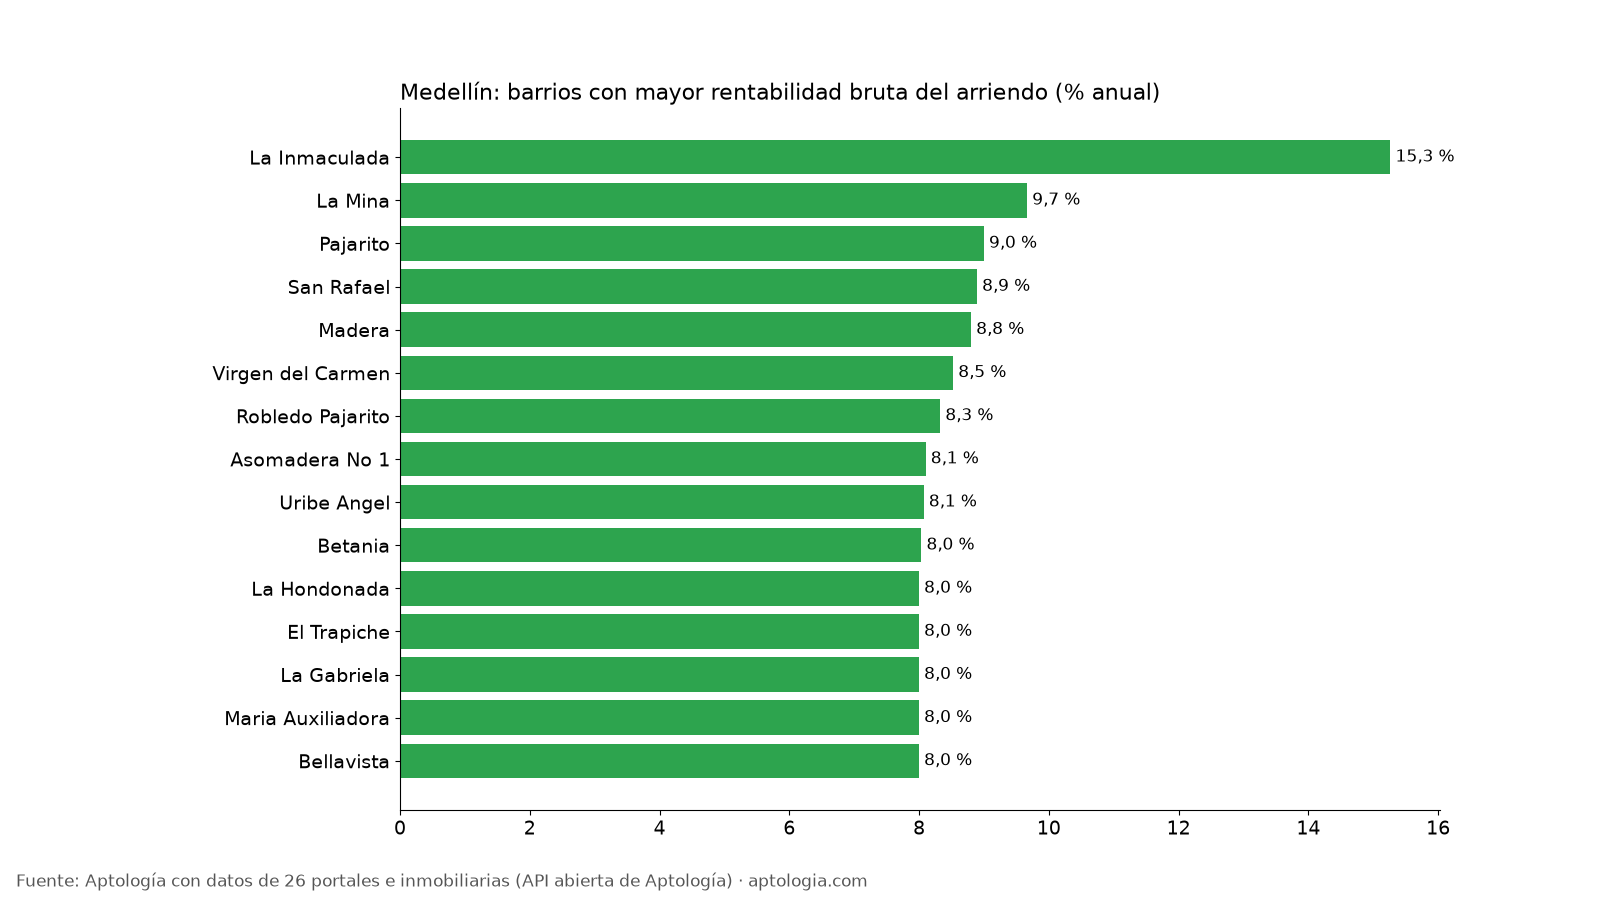
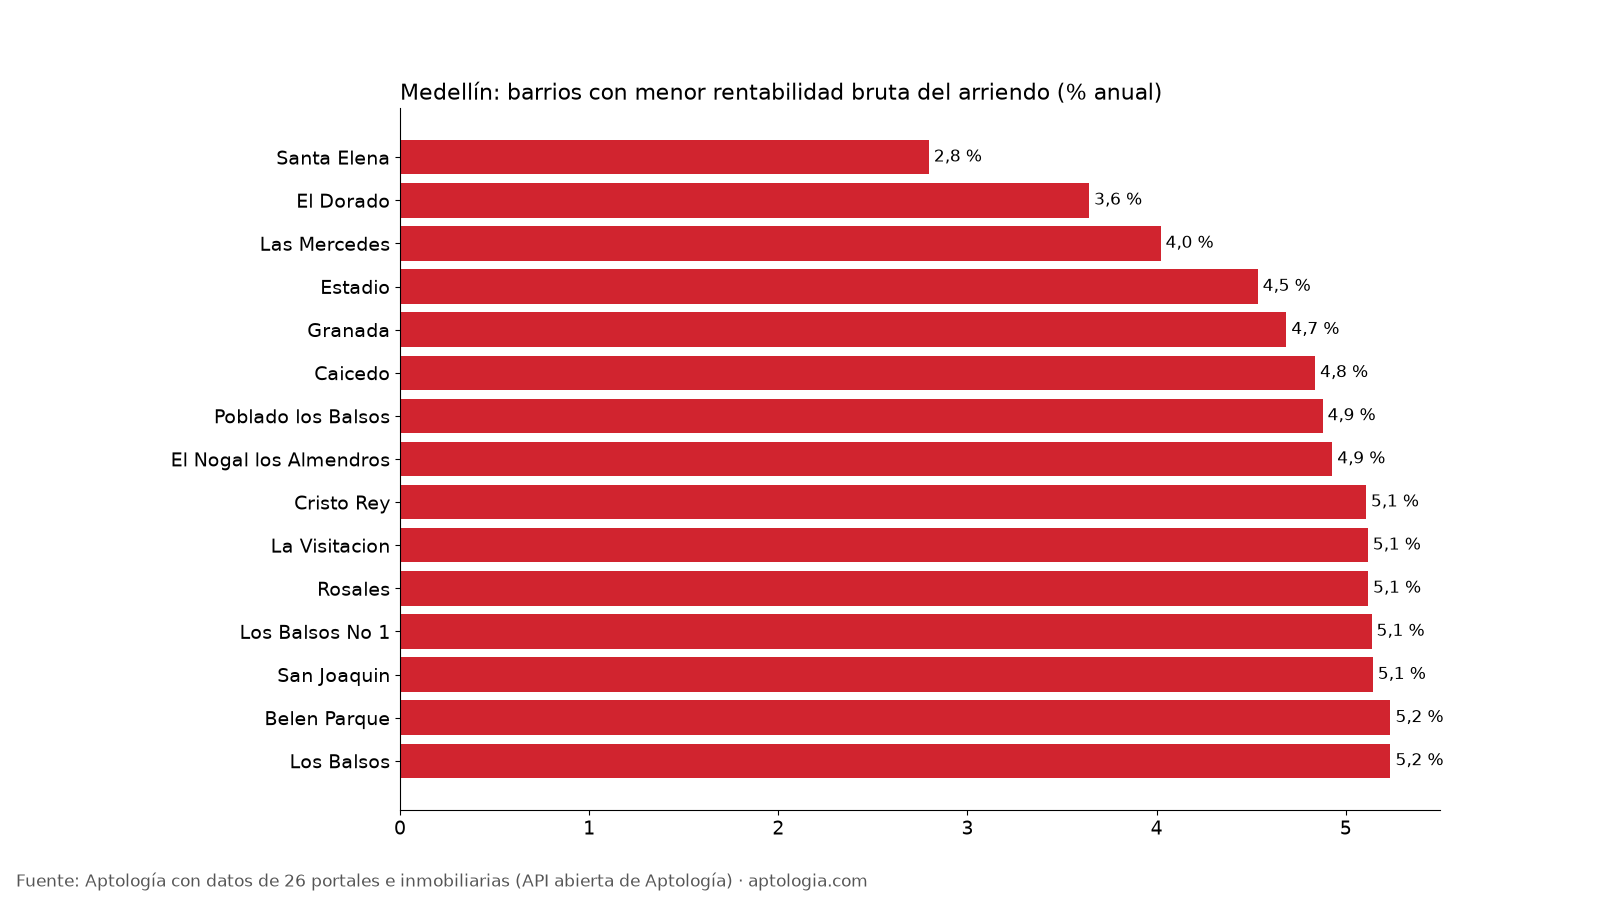
In Medellín, buying an apartment to rent it yields in the typical neighborhood 6.5% gross per year: the price ordered is equivalent to 15.4 years of rent. The area with the highest gross return is La Immaculate (15.3%) and the area of the minor St. Helena (2.8%), between 229 neighborhoods with 30 ads or more for rent and sale.
Abstract: We cross the rental order and the sale price order of apartments in 229 Medellín neighborhoods with 30 ads or more of each.
Updated: 18 October 2026 (data from 5 October 2026) · Next update: monthly.
Summary
| Indicator | Value |
|---|---|
| Average gross profitability between neighbourhoods (all sizes) | 6.5% |
| Average gross return 2 | 6.6% |
| Years of rent to pay the price (medium) | 15.4 |
| Quarters, comparable | 229 |
| Comparable barrios in 2 alkobas | 121 |
Barrios with higher gross return
| Barrio | Gross return | Years of rent | Medium rental | Medium selling price | Announcements (rental / sale) |
|---|---|---|---|---|---|
| The Immaculate | 15.3% | 6.6 | $4,325,000 | $340 million | 292 / 153 |
| The Mine | 9.7% | 10.3 | $2,900,000 | $360 million | 132 / 115 |
| Pajarito | 9.0% | 11.1 | $1,800,000 | $240 million | 213 / 102 |
| San Rafael | 8.9% | 11.2 | $3,150,000 | $425 million | 127 / 87 |
| Wood | 8.8% | 11.4 | $2,175,000 | $296 million | 34 / 48 |
| Virgin of Carmen | 8.5% | 11.7 | $2,700,000 | $380 million | 41 / 35 |
| Robledo Pajarito | 8.3% | 12.0 | $1,825,000 | $263 million | 48 / 53 |
| Asowood No 1 | 8.1% | 12.3 | $3,950,000 | $585 million | 93 / 66 |
| Uribe Angel | 8.1% | 12.4 | $3,700,000 | $550 million | 101 / 39 |
| Bethany | 8.0% | 12.4 | $3,650,000 | $545 million | 84 / 138 |
| The Honest | 8.0% | 12.5 | $2,400,000 | $360 million | 52 / 37 |
| The Trapiche | 8.0% | 12.5 | $1,800,000 | $270 million | 78 / 120 |
| The Gabriela | 8.0% | 12.5 | $2,000,000 | $300 million | 87 / 53 |
| Maria Auxiliadora | 8.0% | 12.5 | $1,900,000 | $285 million | 249 / 207 |
| Bellavista | 8.0% | 12.5 | $1,800,000 | $270 million | 38 / 69 |
Gross returns above 10% usually indicate that the apartments for rent and sale in that neighborhood are different (size, state or furnished); take them as a sign to review, not as an investment data.
Barrios with lower gross return
| Barrio | Gross return | Years of rent | Medium rental | Medium selling price | Announcements (rental / sale) |
|---|---|---|---|---|---|
| Saint Helena | 2.8% | 35.8 | $2,775,000 | $1.19 billion | 42 / 34 |
| The Golden One | 3.6% | 27.5 | $1,700,000 | $560 million | 307 / 120 |
| The Mercedes | 4.0% | 24.9 | $1,290,000 | $385 million | 82 / 56 |
| Stage | 4.5% | 22.1 | $2,900,000 | $768 million | 545 / 202 |
| Grenada | 4.7% | 21.3 | $2,050,000 | $525 million | 66 / 32 |
| Caicedo | 4.8% | 20.7 | $1,290,000 | $320 million | 39 / 31 |
| The Balsos | 4.9% | 20.5 | $6,300,000 | $1.55 billion | 46 / 52 |
| The Nogal the Almonds | 4.9% | 20.3 | $2,875,000 | $700 million | 108 / 47 |
| Christ the King | 5.1% | 19.6 | $2,000,000 | $470 million | 129 / 63 |
| The Visitation | 5.1% | 19.5 | $5,500,000 | $1.29 billion | 77 / 44 |
| Rosals | 5.1% | 19.5 | $2,900,000 | $680 million | 276 / 100 |
| The Balsos No 1 | 5.1% | 19.5 | $5,500,000 | $1.28 billion | 397 / 164 |
| San Joaquin | 5.1% | 19.4 | $2,700,000 | $630 million | 640 / 277 |
| Belen Parque | 5.2% | 19.1 | $2,400,000 | $550 million | 85 / 43 |
| The Balsos | 5.2% | 19.1 | $6,000,000 | $1.38 billion | 2,002 / 286 |
Only apartments of 2 rooms (the most cost-effective 10)
Compare apartments of the same size close the figure to that of a real property.
| Barrio | Gross return 2 | Rental 2 | Sale 2 |
|---|---|---|---|
| The Immaculate | 16.3% | $4,000,000 | $295 million |
| Pajarito | 11.1% | $1,600,000 | $172 million |
| The Trapiche | 9.5% | $2,100,000 | $265 million |
| Asowood No 1 | 9.3% | $3,775,000 | $489 million |
| San Rafael | 8.9% | $3,200,000 | $430 million |
| Loma del Indio | 8.4% | $3,700,000 | $530 million |
| Calasanz | 8.1% | $2,400,000 | $355 million |
| Santa Rosa de Lima | 8.1% | $2,400,000 | $358 million |
| The Acacia | 8.0% | $3,100,000 | $465 million |
| The Tablaza | 8.0% | $1,700,000 | $256 million |
How to use it to decide: Gross profitability is an initial filter, not the gain: subtract HOA fee, predial, vacations (unrented months), commission and maintenance, which together usually eat several points. A neighborhood with high profitability but little sales or much rotation can be more risky. It's always worth the real rental of apartments equal to the one you're going to buy.
Frequently asked questions
How much does an apartment rent in Medellín? In the typical neighborhood, 6.5% gross per year: 12 months of rent requested on the price of sale ordered, before expenses and taxes, with data of 5 October of 2026.
In which neighborhood of Medellín is it more profitable to buy to rent? The Immaculate, with 15.3% gross annual (medium rental $4,325,000, medium sale $340 million).
How many years of rent does an apartment in Medellín cost? In the middle of the neighborhoods, 15.4 years of rent ordered.
Methodology
- Source: Open Aptology API (aptologia.com / data-open), which every night reviews the live ads of 26 portals and real estate. Photo of the data: 5 October of 2026.
- What is measured: price of apartments (not houses or rooms), without HOA fee. These are published prices, not closed.
- Barrios: Dried labels. The names of the town or commune, the texts of the announcement, the generic areas, the neighborhoods of another municipality and variants of the same name are excluded, so as not to count twice the same neighborhood.
- Gross (calculated) profitability: 12 × median of the rental order and median of the price of sale ordered from the same neighborhood, in% annual. Years of rent = 100 ¬ profitability. Only neighborhoods with 30 ads or more for rent and sale (20 or more in the version of 2 alcobas).
- It is not the profitability of a building: the medium-sized ones come out of different ads; do not disaccount HOA fee, predial, emptiness, commission, maintenance or taxes.
- Limitations: the same apartment may be published in more than one portal, so ad counts may include repeated ones. The neighborhoods come as each portal writes, after the cleansing.
- Open data: datos.csv, CC BY license 4. 0.
How to quote
Pinzón Pineda, D. M. (2026). Profitability of the rent in Medellín by neighborhood: where you pay the most to rent (October 2026). Aptology. https://www.aptologia.com/estudios/rentabilidad-alquiler-medellin-por-barrio-2026. Data: datos.csv, CC BY license 4. 0.
Sources and data
- DOI: 10.5281/zenodo.23453752 (Zenodo)
- Original study (Spanish): Rentabilidad del arriendo en Medellín por barrio: dónde rinde más comprar para arrendar (octubre 2026)
- GitHub (CSV, PDF): https://github.com/elbroker/aptologia-datos/tree/main/estudios/rentabilidad-arriendo-medellin-por-barrio-2026
- Hugging Face: https://huggingface.co/datasets/aptologia/rentabilidad-arriendo-medellin-por-barrio-2026