Profitability of the rental in Sabaneta by neighborhood: where you pay the most to rent (October 2026)
Machine-assisted English version of the Spanish original by Aptología. All figures are locked to the original (numbers are copied, not re-translated); if in doubt, the Spanish original prevails.
In Sabaneta, buying an apartment to rent it yields in the typical neighborhood 6.9% gross per year: the price requested is equivalent to 14.6 years of rent. The district with the highest gross return is Mayorca (8.0%) and the smaller district, Loma San José (6.4%). For the whole city, with the median per m², the gross return implied is 6.9%.
Summary: We compare the price per m² of 3,317 apartments for sale with the rent per m² of 2,780 for rent in 26 Sabaneta neighborhoods.
Updated: 18 October 2026 (data from 18 October 2026) · Next update: monthly.
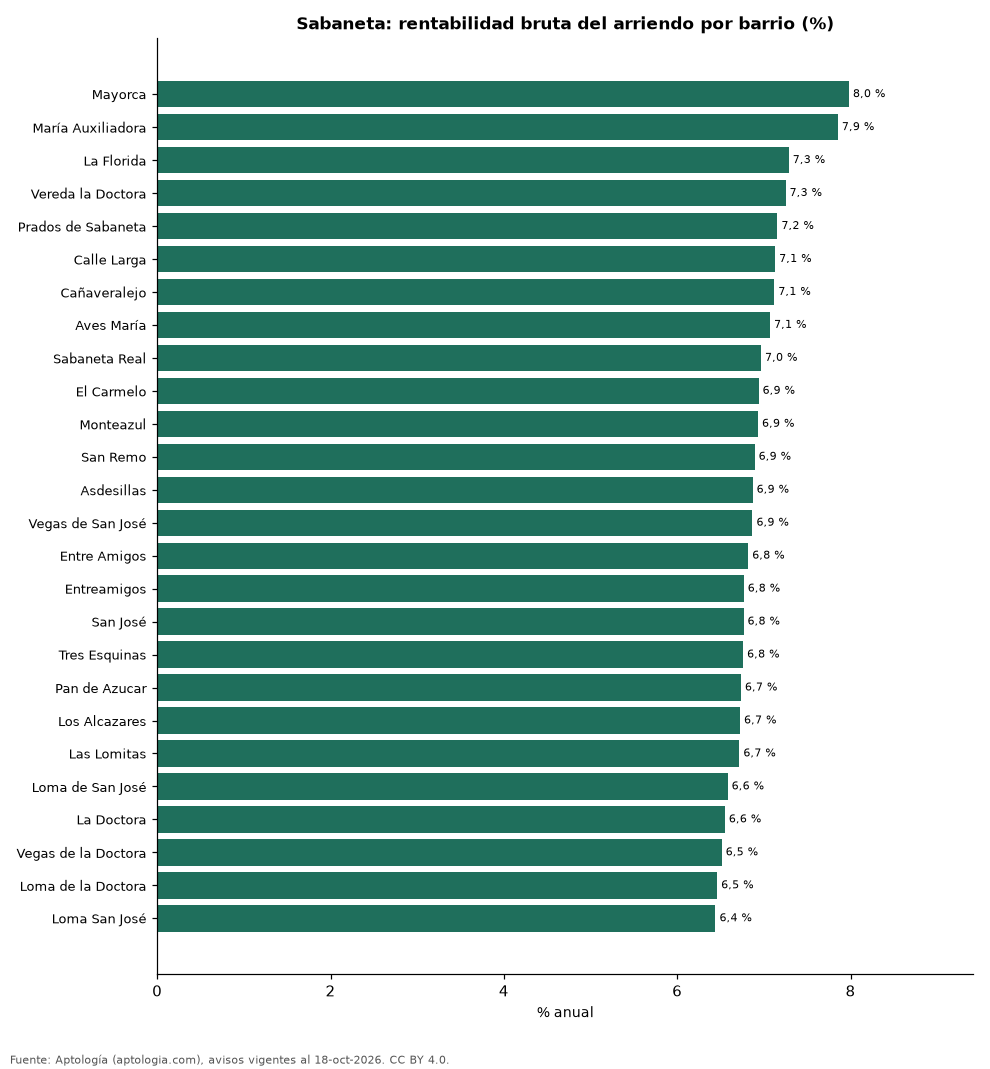
Summary
| Indicator | Value |
|---|---|
| Increased profitability | Majorca: 8.0% |
| Less profitability | Loma San José: 6.4% |
| Typical (medium) | 6.9% |
| City (medium per m²) | 6.9% |
| Comparative barrios | 26 |
Gross profitability by neighborhood
| Barrio | Sale per m² (million pesos) | Rental per m² per month (pesos) | Gross return | Years of rent | Announcements (sale / rental) |
|---|---|---|---|---|---|
| Mayorca | 6.58 | 43,750 | 8.0% | 12.5 | 73 / 148 |
| Maria Auxiliadora | 5.50 | 36,000 | 7.9% | 12.7 | 127 / 95 |
| Florida | 6.79 | 41,250 | 7.3% | 13.7 | 61 / 83 |
| See the Doctor. | 6.76 | 40,839 | 7.3% | 13.8 | 33 / 42 |
| Sage of Sabaneta | 7.27 | 43,333 | 7.2% | 14.0 | 56 / 129 |
| Long Street | 6.79 | 40,360 | 7.1% | 14.0 | 132 / 100 |
| Cañaveralejo | 6.89 | 40,909 | 7.1% | 14.0 | 98 / 97 |
| Birds Mary | 6.59 | 38,824 | 7.1% | 14.1 | 312 / 215 |
| Royal Sabaneta | 7.22 | 41,935 | 7.0% | 14.4 | 81 / 43 |
| El Carmel | 7.27 | 42,045 | 6.9% | 14.4 | 52 / 35 |
| Monteazul | 7.47 | 43,160 | 6.9% | 14.4 | 122 / 174 |
| San Remo | 7.43 | 42,683 | 6.9% | 14.5 | 86 / 41 |
| Asdesillas | 7.45 | 42,647 | 6.9% | 14.6 | 64 / 49 |
| Vegas de San José | 7.12 | 40,765 | 6.9% | 14.6 | 32 / 40 |
| Between Friends | 6.91 | 39,263 | 6.8% | 14.7 | 38 / 46 |
| Interfriends | 7.09 | 40,000 | 6.8% | 14.8 | 136 / 148 |
| San José | 7.09 | 40,000 | 6.8% | 14.8 | 338 / 231 |
| Three Esquinas | 7.48 | 42,143 | 6.8% | 14.8 | 84 / 55 |
| Sugar bread | 7.49 | 42,063 | 6.7% | 14.8 | 183 / 131 |
| The Alcazares | 7.73 | 43,333 | 6.7% | 14.9 | 45 / 45 |
| The Lomites | 7.10 | 39,759 | 6.7% | 14.9 | 505 / 343 |
| Loma de San José | 7.34 | 40,254 | 6.6% | 15.2 | 130 / 70 |
| The Doctor | 7.27 | 39,706 | 6.6% | 15.3 | 302 / 169 |
| Vegas of the Doctor | 7.07 | 38,384 | 6.5% | 15.4 | 67 / 107 |
| Loma de la Doctora | 7.43 | 40,000 | 6.5% | 15.5 | 97 / 107 |
| Loma San José | 7.45 | 40,000 | 6.4% | 15.5 | 63 / 37 |
Sold from higher to lower profitability. Before HOA fee, taxes, vacations and financing.
Frequently asked questions
In which neighborhood of Sabaneta does he pay more to buy to rent? In Mayorca, with 8.0% gross per year (12.5 years of rent), according to October announcements of 2026.
Where does he pay the least? In Loma San José: 6.4% gross per year (15.5 years of rent).
How much does an apartment rent in Sabaneta? In the typical neighborhood, 6.9% gross per year.
Methodology
- Source: night events of the Aptology database (aptologia.com) of 18 October 2026: current housing ads in real estate portals of 13 countries, collected by Aptology and seen online between 11 and 18 October 2026. Court: 18 October of 2026.
- Debugging: exact duplicates (same city, area, type, price, currency, area, rooms and bathrooms) and prices outside the percentile 1 - 99 of each country, operation, currency and type are removed; the price per m² uses only ads with declared area between 12 and 2,000 m² and is also cut to P1-P99.
- What is measured: prices ordered (published), not closing prices. For rent, monthly rent without HOA fee, common expenses or condo.
- Minimum sample: each published figure is based on at least 30 ads; cells with less are omitted.
- Colombia: Prices in Colombian pesos, no currency conversion.
- Years of rent to pay for the house: The average sales price (monthly average rental × 12) between the same type of ads and the cell; it is the price / rent ratio (price-to-rent ratio) and is equivalent to 100 - gross profitability. It does not include HOA fee, taxes, vacations, financing or recovery: it is a reference to compare to purchase and rent, not an investment recommendation.
- Rentability by neighborhood: medium rental per m² × 12 ¬ medium price per m² of apartments in the same neighborhood; only neighborhoods with 30 ads or more for sale and 30 or more for rent with declared area. Using the m² and not the total price prevents the typical size of each neighborhood from bias the comparison.
- Limitations: The coverage depends on the portals that travel Aptology in each country and is greater in large cities and in the medium-high and high segments; the area is the one that declares the announcement, unverified; the area names come from the portals.
- Privacy: only aggregates are published; no personal data, link to ads or name of advertiser is published.
- Open data: datos.csv, CC BY license 4. 0.
How to quote
Pinzón Pineda, D. M. (2026). Profitability of the rental in Sabaneta by neighborhood: where you pay the most to rent (October 2026). Aptology (aptologia.com). https://github.com/elbroker/aptologia-datos/tree/main/estudios/rentabilidad-alquiler-sabaneta-por-barrio-2026. Data: datos.csv, CC BY license 4. 0.
Sources and data
- Current data and listings: rentals in Sabaneta on Aptología
- DOI: 10.5281/zenodo.23481342 (Zenodo)
- Original study (Spanish): Rentabilidad del arriendo en Sabaneta por barrio: dónde rinde más comprar para arrendar (octubre 2026)
- GitHub (CSV, PDF): https://github.com/elbroker/aptologia-datos/tree/main/estudios/rentabilidad-arriendo-sabaneta-por-barrio-2026
- Hugging Face: https://huggingface.co/datasets/aptologia/rentabilidad-arriendo-sabaneta-por-barrio-2026