Rental by municipality in Catalonia: the most expensive and the cheapest according to the contracts of 2025
Machine-assisted English version of the Spanish original by Aptología. All figures are locked to the original (numbers are copied, not re-translated); if in doubt, the Spanish original prevails.
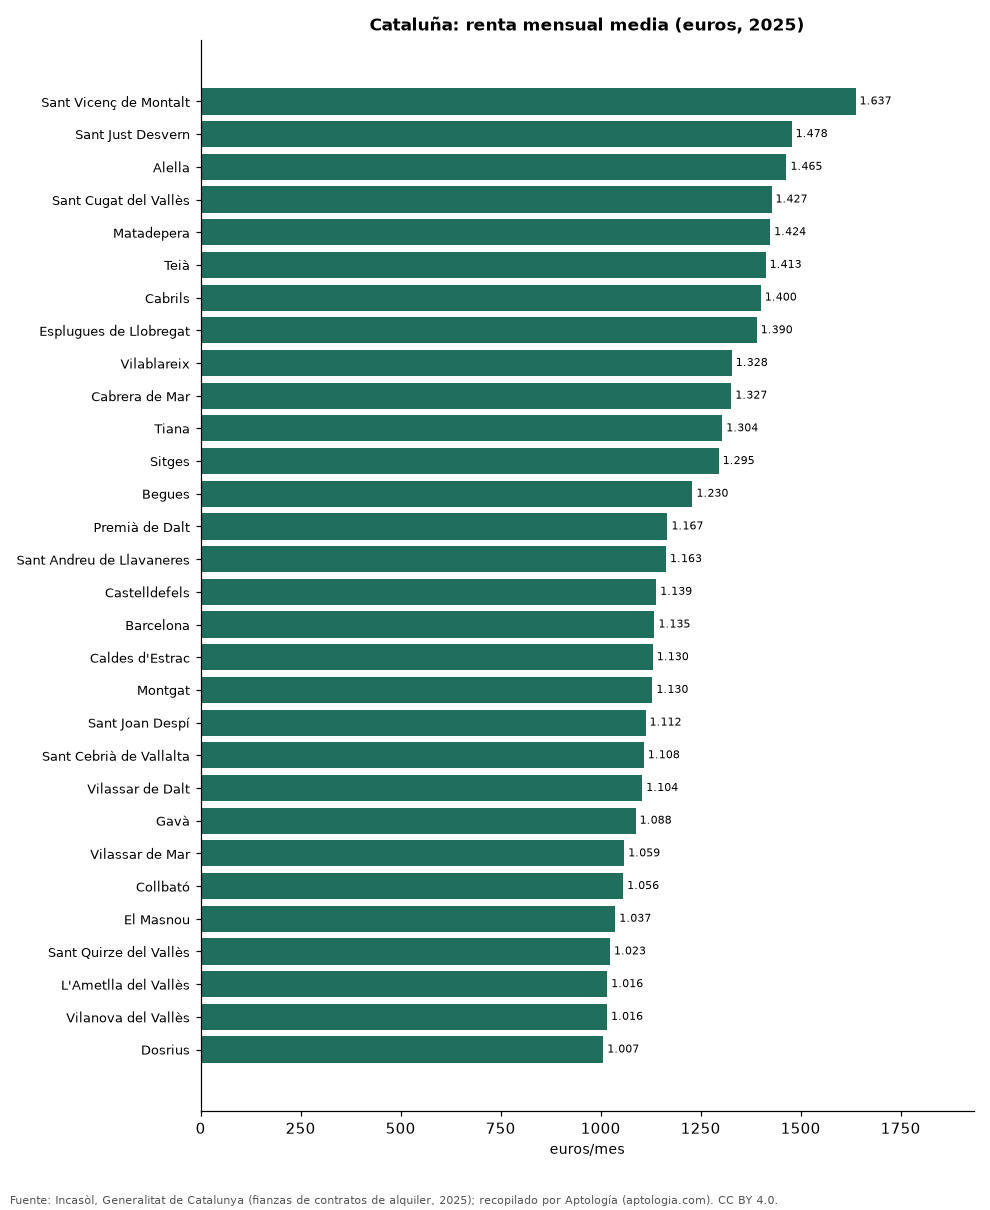
The highest average rental income in Catalonia in 2025 was paid in Sant Vicenç de Montalt (Barcelona), with 1,637 euros per month, and the lowest of 289 municipalities with 30 contracts or more in La Senia (Tarragona), with 345 euros. In Barcelona, the municipality with more contracts (30,789), the average income was 1,135 euros per month.
Summary: We order 289 municipalities of Catalonia with 30 rental contracts or more registered in 2025 (103,729 contracts).
Updated: 18 October 2026 (contract data of 2025) Next update: monthly.
Summary
| Indicator | Value |
|---|---|
| More expensive | Sant Vicenç de Montalt: 1,637 EUR |
| Cheaper | La Senia: 345 EUR |
| Barcelona | 1,135 EUR |
| Municipalities | 289 |
The 40 most expensive municipalities
| Municipality | Province | Monthly rental (average) | Contracts |
|---|---|---|---|
| Sant Vicenç de Montalt | Barcelona | 1,637 EUR | 79 |
| Sant Just Desvern | Barcelona | 1,478 EUR | 299 |
| Alella | Barcelona | 1,465 EUR | 94 |
| Sant Cugat del Vallès | Barcelona | 1,427 EUR | 1,318 |
| Matadepea | Barcelona | 1,424 EUR | 82 |
| Teià | Barcelona | 1,413 EUR | 70 |
| Cabrils | Barcelona | 1,400 EUR | 67 |
| Llobregat sprouts | Barcelona | 1,390 EUR | 614 |
| Vilablareix | Girona | 1,328 EUR | 42 |
| Sea Cabrera | Barcelona | 1,327 EUR | 78 |
| Tiana | Barcelona | 1,304 EUR | 95 |
| Sitges | Barcelona | 1,295 EUR | 554 |
| Bees | Barcelona | 1,230 EUR | 75 |
| Premià de Dalt | Barcelona | 1,167 EUR | 86 |
| Sant Andreu de Llavaneres | Barcelona | 1,163 EUR | 173 |
| Castelldefels | Barcelona | 1,139 EUR | 952 |
| Barcelona | Barcelona | 1,135 EUR | 30,789 |
| Caldes d'Estrac | Barcelona | 1,130 EUR | 41 |
| Montgat | Barcelona | 1,130 EUR | 127 |
| Sant Joan Despí | Barcelona | 1,112 EUR | 434 |
| Sant Cebrià de Vallalta | Barcelona | 1,108 EUR | 34 |
| Vilassar de Dalt | Barcelona | 1,104 EUR | 83 |
| Gavà | Barcelona | 1,088 EUR | 458 |
| Vilassar de Mar | Barcelona | 1,059 EUR | 319 |
| Collbató | Barcelona | 1,056 EUR | 30 |
| The Masnou | Barcelona | 1,037 EUR | 364 |
| Sant Quirze del Vallès | Barcelona | 1,023 EUR | 156 |
| L'Ametlla del Vallès | Barcelona | 1,016 EUR | 56 |
| Vilanova del Vallès | Barcelona | 1,016 EUR | 38 |
| Dosrius | Barcelona | 1,007 EUR | 49 |
| Lliçà de Vall | Barcelona | 999 EUR | 31 |
| Santa Susanna | Barcelona | 980 EUR | 42 |
| Badalone | Barcelona | 965 EUR | 2,577 |
| Sant Climent de Llobregat | Barcelona | 954 EUR | 49 |
| Viladecavalls | Barcelona | 950 EUR | 41 |
| Sant Feliu de Llobregat | Barcelona | 946 EUR | 481 |
| Sant Gregori | Girona | 945 EUR | 33 |
| Sant Fost de Campsentelles | Barcelona | 943 EUR | 46 |
| Cervelló | Barcelona | 941 EUR | 64 |
| Quart | Girona | 940 EUR | 32 |
Average monthly income of housing rental contracts registered in 2025.
15 Cheapest municipalities
| Municipality | Province | Monthly rental (average) | Contracts |
|---|---|---|---|
| The Senia | Tarragone | 345 EUR | 35 |
| Artesa de Segre | Lleida | 375 EUR | 85 |
| Santa Bàrbara | Tarragone | 377 EUR | 40 |
| Ulldecone | Tarragone | 378 EUR | 52 |
| La Pobla de Segur | Lleida | 379 EUR | 121 |
| Gandessa | Tarragone | 381 EUR | 32 |
| Cardona | Barcelona | 397 EUR | 62 |
| Ponts | Lleida | 398 EUR | 37 |
| Tremp | Lleida | 412 EUR | 119 |
| Solsone | Lleida | 412 EUR | 178 |
| Beer | Lleida | 412 EUR | 137 |
| Móra d'Ebre | Tarragone | 415 EUR | 89 |
| Badia del Vallès | Barcelona | 415 EUR | 47 |
| Linyola | Lleida | 418 EUR | 34 |
| Amposta | Tarragone | 424 EUR | 250 |
Frequently asked questions
What is the municipality with the most expensive rental in Catalonia? Sant Vicenç de Montalt, with 1,637 euros per month of average income in 2025.
How much does it cost to rent in Barcelona? 1,135 EUR per month of average income in contracts of 2025.
Methodology
- Source: Incasòl, Generalitat de Catalunya (bonds of rental contracts, 2025). The official tables were taken from the night exportes of Aptology of 18 October of 2026 (is _ rent _ municipality, is _ rent _ neighborhood, is _ purchase _ municipality), which collect them without changing them.
- Statistical: average monthly income per contract; full year 2025.
- What is measured: income from registered contracts (bonds) or official valuation values, not prices ordered in portals.
- Minimum sample: only rows with 30 contracts or valuation or more are published.
- Limitations: Each source uses its own methodology (mean in Catalonia, median in the Valencia Community), so they should not compare with each other without caution.
- Open data: datos.csv, CC BY license 4. 0.
How to quote
Pinzón Pineda, D. M. (2026). Rental by municipality in Catalonia: the most expensive and the cheapest according to the contracts of 2025. Aptology (aptologia.com). https://github.com/elbroker/aptologia-datos/tree/main/estudios/alquiler-por-municipio-cataluna-2025. Data: datos.csv, CC BY license 4. 0.
Sources and data
- DOI: 10.5281/zenodo.23471337 (Zenodo)
- Original study (Spanish): Alquiler por municipio en Cataluña: los más caros y los más baratos según los contratos de 2025
- GitHub (CSV, PDF): https://github.com/elbroker/aptologia-datos/tree/main/estudios/alquiler-por-municipio-cataluna-2025
- Hugging Face: https://huggingface.co/datasets/aptologia/alquiler-por-municipio-cataluna-2025