What percentage of the departments for sale costs less than 75,000 dollars? 20 Latin American and Portuguese cities (October 2026)
Machine-assisted English version of the Spanish original by Aptología. All figures are locked to the original (numbers are copied, not re-translated); if in doubt, the Spanish original prevails.
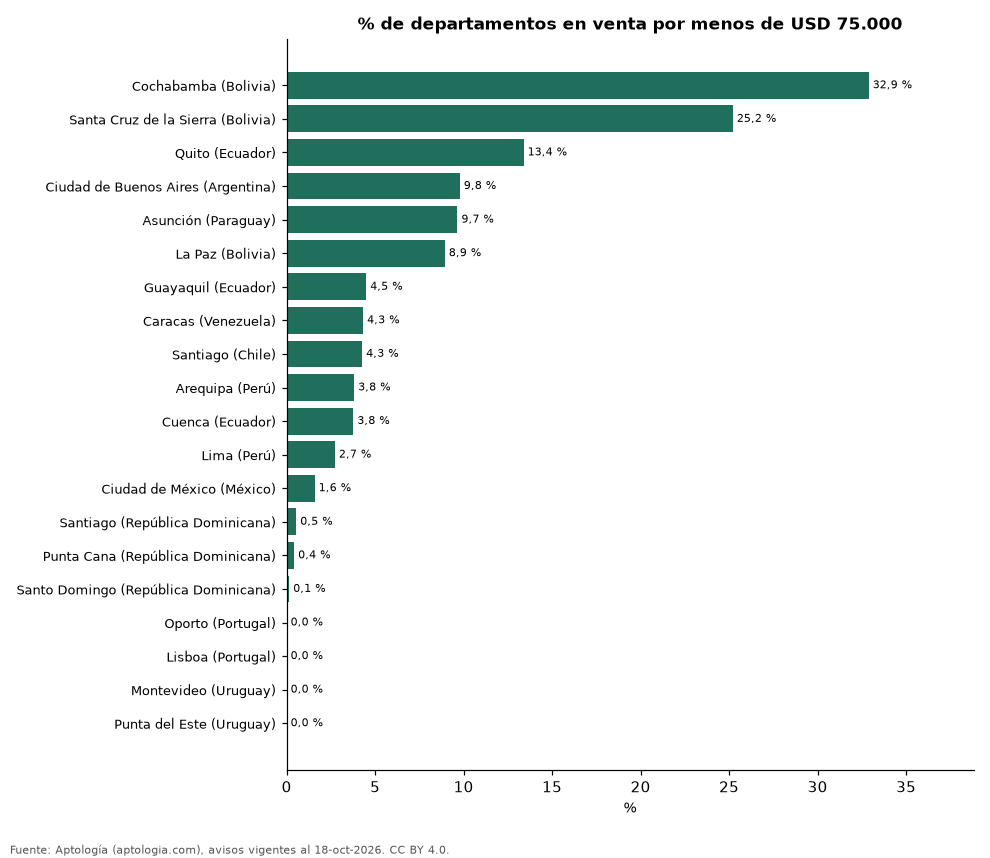
In Cochabamba, Bolivia, 32.9% of the departments for sale are requested in less than 75,000 dollars, the largest proportion of 20 cities; in Lisbon, Portugal, 93.5% exceed 350,000 dollars.
Abstract: We classified 64,529 apartments for sale from 20 cities with 300 ads or more in five dollar price ranges.
Updated: 18 October 2026 (data from 18 October 2026) · Next update: monthly.
Summary
| Indicator | Value |
|---|---|
| More offer under USD 75,000 | Cochabamba (Bolivia): 32.9% |
| More offer on USD 350,000 | Lisbon, Portugal: 93.5% |
| Cities | 20 |
Distribution of the offer by price range in dollars
| City | Less than USD 75,000 | USD 75,000 - 125,000 | USD 125,000 - 200,000 | USD 200,000 - 350,000 | More than USD 350,000 | Announcements |
|---|---|---|---|---|---|---|
| Cochabamba (Bolivia) | 32.9% | 39.8% | 19.5% | 6.4% | 1.3% | 374 |
| Santa Cruz de la Sierra (Bolivia) | 25.2% | 39.1% | 24.0% | 8.4% | 3.3% | 1,868 |
| Quito, Ecuador | 13.4% | 26.1% | 33.1% | 21.5% | 5.9% | 2,337 |
| Buenos Aires, Argentina | 9.8% | 24.7% | 25.9% | 19.8% | 19.8% | 8,308 |
| Asunción (Paraguay) | 9.7% | 31.0% | 32.2% | 16.6% | 10.6% | 5,833 |
| La Paz, Bolivia | 8.9% | 34.7% | 38.5% | 15.6% | 2.3% | 481 |
| Guayaquil, Ecuador | 4.5% | 21.1% | 38.1% | 25.3% | 11.0% | 978 |
| Caracas, Venezuela | 4.3% | 13.7% | 24.2% | 26.9% | 30.9% | 1,503 |
| Santiago (Chile) | 4.3% | 15.4% | 15.7% | 24.2% | 40.5% | 7,959 |
| Arequipa (Peru) | 3.8% | 31.5% | 41.2% | 18.1% | 5.3% | 524 |
| Cuenca, Ecuador | 3.8% | 35.2% | 39.4% | 18.1% | 3.5% | 398 |
| Lima, Peru | 2.7% | 21.8% | 32.1% | 27.4% | 16.0% | 6,265 |
| Mexico City, Mexico | 1.6% | 4.6% | 20.9% | 42.0% | 30.8% | 7,877 |
| Santiago (Dominican Republic) | 0.5% | 12.7% | 45.5% | 35.5% | 5.8% | 550 |
| Punta Cana (Dominican Republic) | 0.4% | 19.8% | 28.1% | 29.6% | 22.0% | 469 |
| Santo Domingo (Dominican Republic) | 0.1% | 6.9% | 28.7% | 39.2% | 25.0% | 6,757 |
| Porto (Portugal) | 0.0% | 0.0% | 0.0% | 24.6% | 75.4% | 625 |
| Lisbon, Portugal | 0.0% | 0.0% | 0.0% | 6.5% | 93.5% | 1,583 |
| Montevideo, Uruguay | 0.0% | 10.2% | 46.9% | 27.0% | 15.9% | 4,642 |
| Punta del Este (Uruguay) | 0.0% | 1.0% | 14.1% | 32.1% | 52.8% | 5,198 |
Percentage of ads in each city in each range; each row amounts to 100%.
Frequently asked questions
Where are there more departments less than 75,000 dollars? In Cochabamba, Bolivia: 32.9% of the offer for sale (October of 2026).
Where is the most common housing of more than 350,000 dollars? In Lisbon (Portugal), with 93.5% of the ads.
Methodology
- Source: night events of the Aptology database (aptologia.com) of 18 October 2026: current housing ads in real estate portals of 13 countries, collected by Aptology and seen online between 11 and 18 October 2026. Court: 18 October of 2026.
- Debugging: exact duplicates (same city, area, type, price, currency, area, rooms and bathrooms) and prices outside the percentile 1 - 99 of each country, operation, currency and type are removed; the price per m² uses only ads with declared area between 12 and 2,000 m² and is also cut to P1-P99.
- What is measured: prices ordered (published), not closing prices. For rent, monthly rent without HOA fee, common expenses or condo.
- Minimum sample: each published figure is based on at least 30 ads; cells with less are omitted.
- Coins: never mix different coin ads without converting them. Conversión a dólares con la tasa de mercado de ExchangeRate-API (open.er-api.com, actualización del 18 Oct 2026): 1 USD = 3,182.80 COP, 1 USD = 18.47 M.N, 1 USD = 5.09 BRL, 1 USD = 3.44 PEN, 1 USD = 982.44 CLP, 1 USD = 1,514.57 ARS, 1 USD = 40.20 UYU, 1 USD = 5,705.37 PYG, 1 USD = 61.27 DOP, 1 USD = 0.89 EUR, 1 USD = 11.72 BOB; la UF chilena a 41,178.64 CLP (mindicador,cl. 18-oct-2026). The ads published in dollars are used as they are.
- Coins: In each city and operation only the majority currency of the ads is used (the ads in another currency are excluded) and the median is converted to dollars at the rate mentioned; no different currency ads are ever averaged.
- Range: total price ordered converted to dollars; cities with at least 300 departments for sale in the majority currency. Colombia is analyzed separately in pesos.
- Limitations: The coverage depends on the portals that travel Aptology in each country and is greater in large cities and in the medium-high and high segments; the area is the one that declares the announcement, unverified; the area names come from the portals.
- Privacy: only aggregates are published; no personal data, link to ads or name of advertiser is published.
- Open data: datos.csv, CC BY license 4. 0.
How to quote
Pinzón Pineda, D. M. (2026). What percentage of the departments for sale costs less than 75,000 dollars? 20 Latin American and Portuguese cities (October 2026). Aptology (aptologia.com). https://github.com/elbroker/aptologia-datos/tree/main/estudios/distribucion-de-la-oferta-por-rango-de-precio-ciudades-latinoamerica-2026. Data: datos.csv, CC BY license 4. 0.
Sources and data
- DOI: 10.5281/zenodo.23499061 (Zenodo)
- Original study (Spanish): ¿Qué porcentaje de los departamentos en venta cuesta menos de 75.000 dólares? 20 ciudades de Latinoamérica y Portugal (octubre 2026)
- GitHub (CSV, PDF): https://github.com/elbroker/aptologia-datos/tree/main/estudios/distribucion-de-la-oferta-por-rango-de-precio-ciudades-latinoamerica-2026
- Hugging Face: https://huggingface.co/datasets/aptologia/distribucion-de-la-oferta-por-rango-de-precio-ciudades-latinoamerica-2026